
At the end of this post you will know how to use the Power Duration Curve as a tool to plan and control your training.
You may also watch the video
Remember that I share my interpretation, approach and practical use of cycling training concepts using a GPS bike computer.
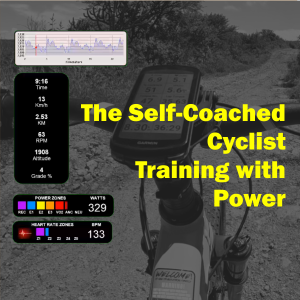
Become a self coached cyclist with the guidance of The Self Coached Cyclist Training with Power, covering everything from training concepts to performance tracking.
and check out our Power Based Training Plans.
This post is part of the Training Concepts series and we use. ideas explained in previous ones. If you have not seen them yet, please do so to get all the benefits of this one.
Check the Blog page for the other posts.
Power output has a direct relation to the time it can be sustained. As the duration increases, from seconds to minutes to hours, power output decreases.
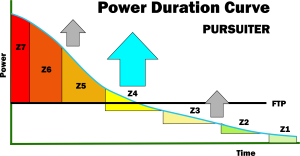
This can be plotted in a graph using power in the vertical axis and time in the horizontal axis.
The points in the graph show the power that can be sustained for a certain duration.

By joining the points, we get the Cycling Power Duration Curve, showing the relationship between power output and duration.
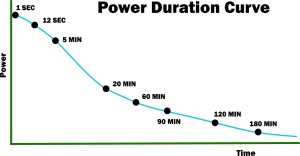
As the duration increases power output decreases, reflecting a cyclist’s ability to sustain high power for short bursts, like sprints, and lower power over extended periods, such as time trials or endurance rides.
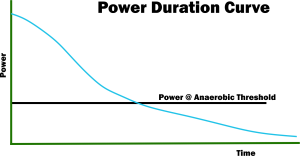
Now, we will add the line that represents the power that can be sustained at the Anaerobic Threshold, that we explained in the first video of the series.
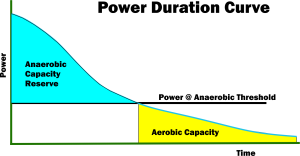
The area above the Anaerobic Threshold and below the Power Duration Curve, shown in blue, is known as the Anaerobic Reserve Capacity.
The area in yellow is what I call the aerobic capacity.
We always use two energy systems, the anaerobic system and the aerobic system. Depending on the effort level, one prevails over the other.
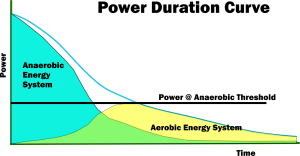
At high power intensities, the Anaerobic Energy system prevails.
As power intensity decreases, the anaerobic energy system influence lowers while the Aerobic Energy System influence starts to grow and prevails at low power intensities.
If you used the Critical Power W Prime Method to estimate the anaerobic threshold, the line representing the power at anaerobic threshold is the Critical Power value you got from the test.
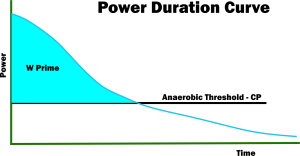
And w prime is the Anaerobic Reserve Capacity
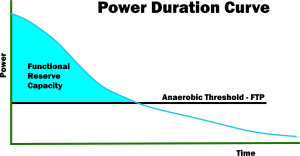
If you used the FTP Method to estimate the anaerobic threshold, the line representing the power at anaerobic threshold is the FTP value you got from the test.
And the Functional Reserve Capacity is the Anaerobic Reserve Capacity.
Being the 7 power zones model the most commonly used by training devices and platforms, this is how they look when overlaid in the Power Duration Curve.
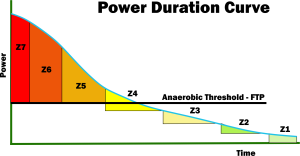
In the Anaerobic region:
- Zone 7 develops Neuromuscular Power
- Zone 6 Anaerobic Capacity
- Zone 5 develops VO2 Max
Zone 4 is a mix of anaerobic and aerobic training and develops the lactate threshold
In the aerobic region
- Zone 3 is tempo training
- Zone 2 is endurance
- Zone 1 is endurance training as well as recovery
Depending on the training emphasis used, you may fall in one of these categories that are known as Phenotypes
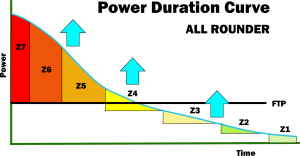
- All Rounder
- Sprinter
- Endurance Rider
- Pursuiter
Using the 7 zones model, this is how they look.
The All Rounder gives the same priority to all training areas maintaining a balance. The Training and Racing with a Power Meter Book describes it as, quoting:
“The all rounder does not necessarily excel at any one thing but is likely competitive in his or her category across a board range of events.”
The Sprinter gives emphasis to the anaerobic region zones training looking to develop maximum power for short durations such as sprints between a few seconds up to 5 minutes.
Training emphasis is in zones 5 to 7 depending on the target.
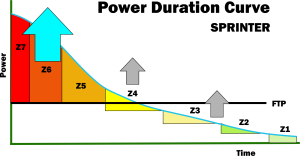
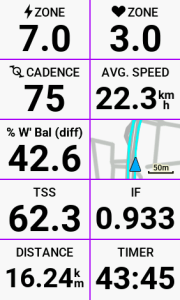
Tracking the Anaerobic Reserve Capacity usage in real time is a great tool for the sprinter. The Garmin Edge devices allow to install a data field that tracks W prime in real time.
The Endurance Rider develops the aerobic system to sustain as high and effort for the longest duration as possible.
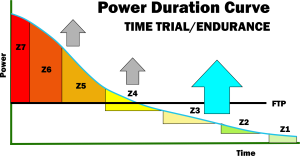
Emphasis is in zones 1 to 3, also depending on the target.
Pursuiter
The training and racing with a power meter book describes it as, quoting
“Implies both a relatively high anaerobic capacity and high aerobic ability.”
Emphasis is in zone 4.
If you have been training with power for some time, you can see the power duration curve in the training platforms used.
In Garmin Connect you can see it in the Power Curve option and it shows its performance for the last 4 weeks, 3 months and one year.
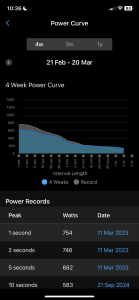
It also shows the power records at different durations and the date where it was obtained. These values can be used to plan your training based on your goals, training zones and phenotype you want to develop.
Training platforms, such as Intervals.icu show it as well.
In my case it is set up to show the data for the last 42 days, to align it with the settings I have in the Power Management Chart or Fitness chart, for the last 90 days and the current season.
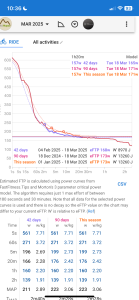
Peak power values in those time frames are also shown and can be used as well to plan your training.
The power curve is not fixed and changes with time as a result of training. Its shape will be modified in accordance to the phenotype as well as increasing the power you can apply at the Anaerobic threshold, shown as an improvement of FTP or Critical Power depending on the model you use.
The opposite can also happen if you stop or reduce your training volume.
The Power duration curve is a mathematical model that is a great tool for training when used properly.
But remember, we are humans, not machines and there are genetic, physiological and psychological factors that also affect riding performance that cannot be included in such a model.
To support your self coaching journey get our free guides that you can download right now, including:
The Self-Coached Cyclist Training with Power: Concepts
Advanced Cycling Planned Workouts in Intervals.icu Video Tutorial
Cycling Fitness CTL Planning Worksheet
The 2025 Cycling Fitness TSS & CTL Planning Worksheet
As well as our full featured eBook The Self Coached Cyclist Training with Power, covering everything from training concepts to performance tracking.
and check out our Power Based Training Plans.